Explore Eddyfi Technologies Product Lines
TubePro™ is the reference in tubing pre-inspection and reporting software that delivers insightful and consistent reports for today's fast-paced heat exchanger inspections. Backed by over 30 years of experience in petrochemical and power generation software development, TubePro delivers comprehensive results quickly. Eddyfi Technologies’ advanced tools include customizable 3D models and intuitive tubesheet mapping. Whether in oil & gas, petrochemicals, power generation, or climate control, TubePro ensures thorough evaluations with features like full tubesheet mapping for 15,000+ tube bundles, 3D visualization, and multi-tube inspection result comparison. Leave it to TubePro for efficient, accurate reporting every time.
What's new in TubePro 6
- Redesigned User Interface (UI): Experience a sleek new interface with a 60% reduction in buttons within the Tubesheet menu. This intuitive design enhances usability and accelerates the onboarding process for new team members.
- Simplified Workflow: Say goodbye to complexity with streamlined processes that ensure efficient navigation. TubePro empowers tubing inspection companies to unlock the full potential of their operations effortlessly.
- Improved Report Variables Manager: Seamlessly access and share customer details, inspection nomenclature, and equipment information within your team. Our redesigned manager makes collaboration easier than ever before.
- Easier tubesheet map creation with grid mode: With TubePro, enjoy faster map creation with a grid mode that aligns the tubes on a defined pitch and angle pattern, boosting confidence and efficiency across inspections of all heat exchanger sizes.
Details
TubePro for any industry requiring shell and tube exchanger inspections
Eddyfi Technologies’ TubePro is designed to represent tubing inspections in shell and tube exchangers across various industries. Regardless of the sector, whether it’s oil & gas, nuclear balance of plant (BoP), maritime, or heating, ventilation, air conditioning, refrigeration (HVACR), TubePro can tackle thorough inspection of multiple shapes and sizes.
Tubes in photos detected automatically
Utilizing a field-captured photo of the heat exchanger, TubePro can automatically identify and detect the tubes within the tubesheet, expediting the tubesheet creation.
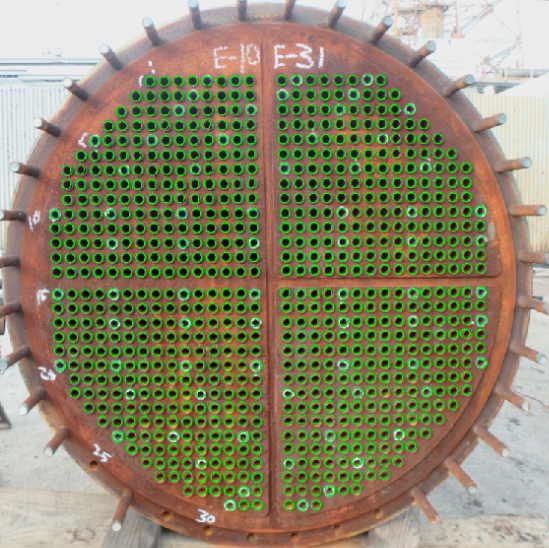
For PDF, DXF, and DWG, it is even easier with a 100% detection rate. This tool is especially handy for large bundles with complex shapes, even with over 10,000 tubes.
Tube pattern tracking simplified
Because not all heat exchangers are alike, TubePro has all the tools to adapt to multiple numbering and sequence patterns for any tubesheet size. Once the tube pattern is created on the tubesheet map, the numbering sequence can be changed to reflect how the inspection was performed or to meet the end customer requirements. Basic vertical and horizontal sequences are most used, but less common patterns, grids, and ordering sequences can be set as well.
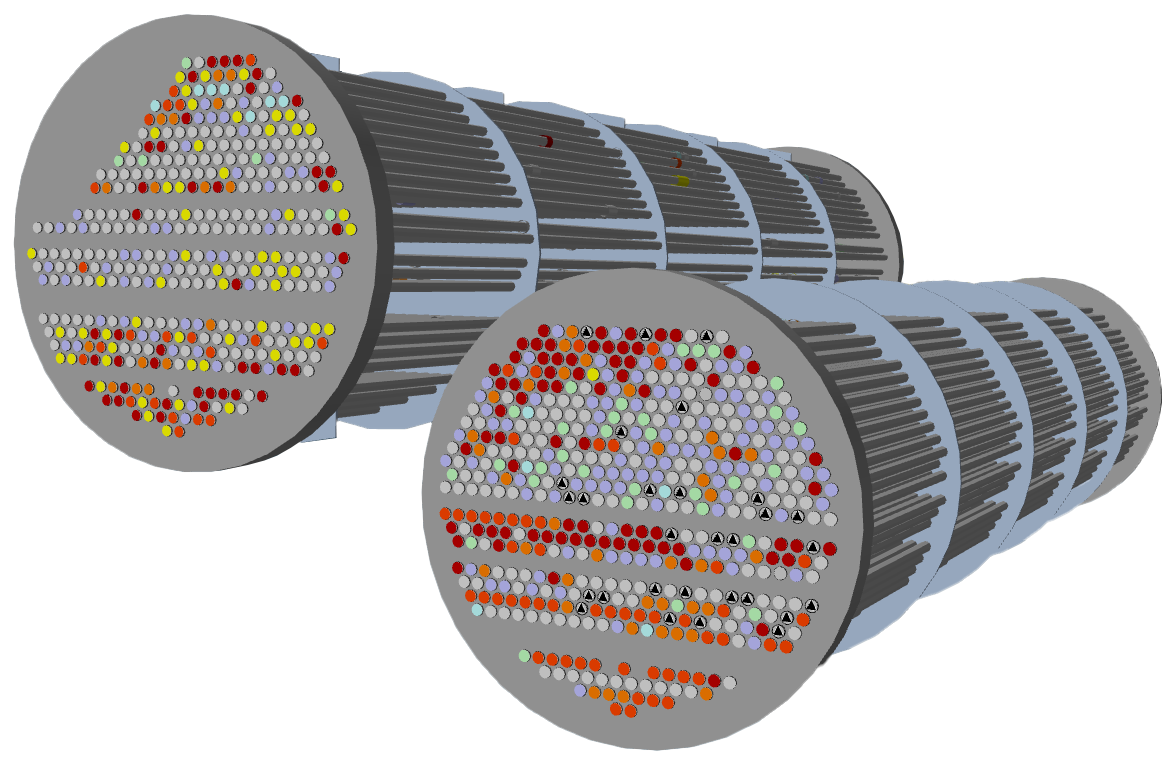
Image: Tube pattern of a condenser showing directional tube row numbering.
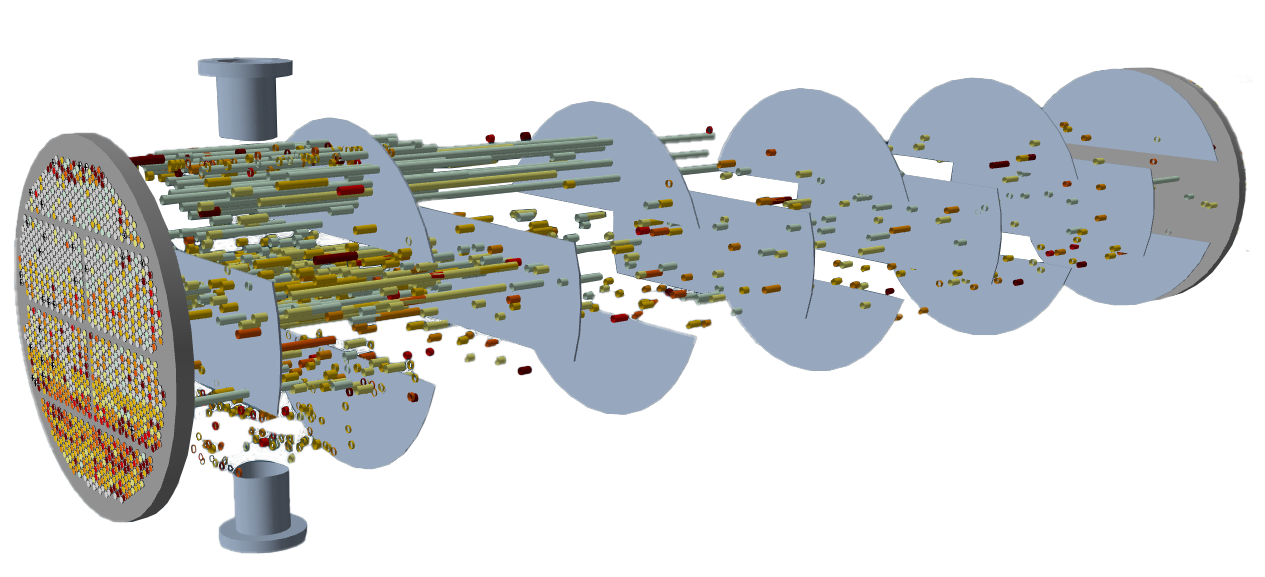
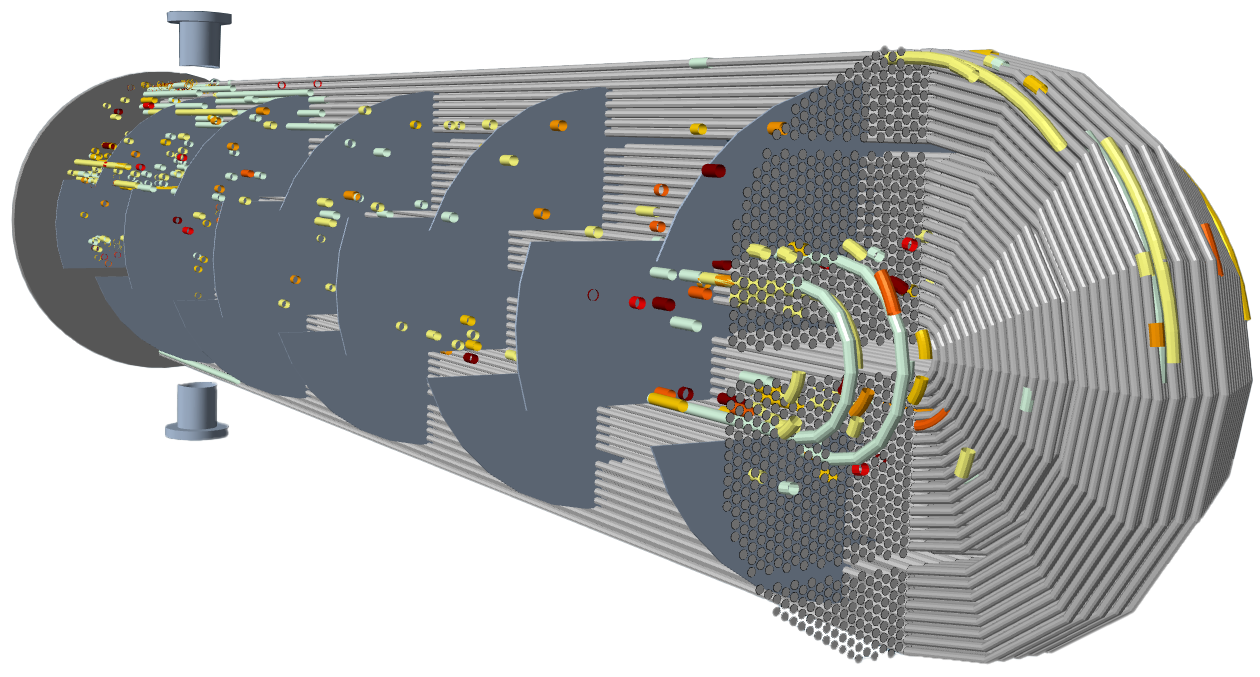
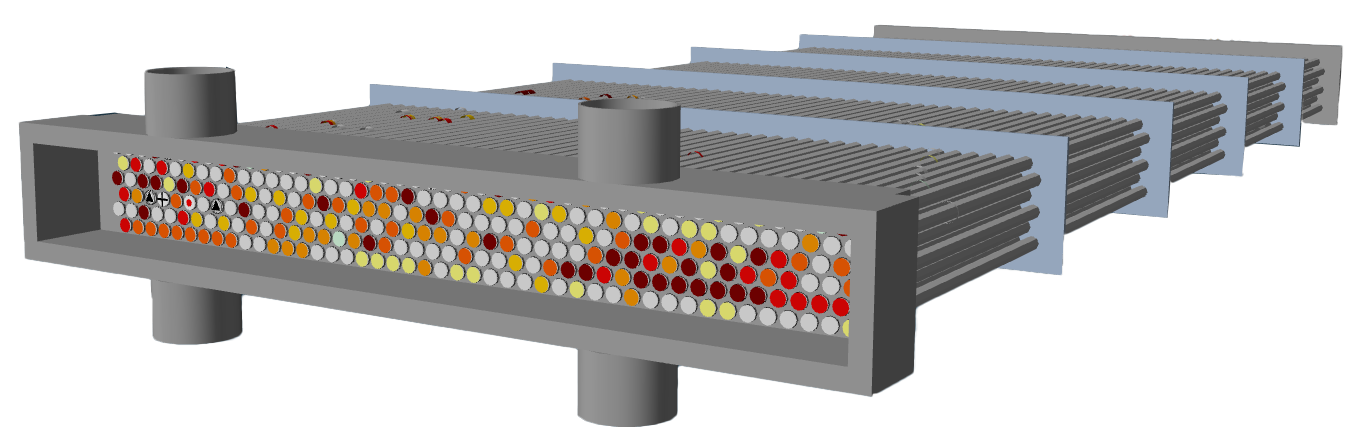
Beyond the tubes, TubePro offers versatile tools to represent u-bends, support plates, tubesheets with partition plates, as well as inlets and outlets. Users can orient, cut, and make representations transparent to enhance context, facilitating a better visualization of defect patterns occurring throughout the length of the heat exchanger.
Multiple inspection data sets and report types supported
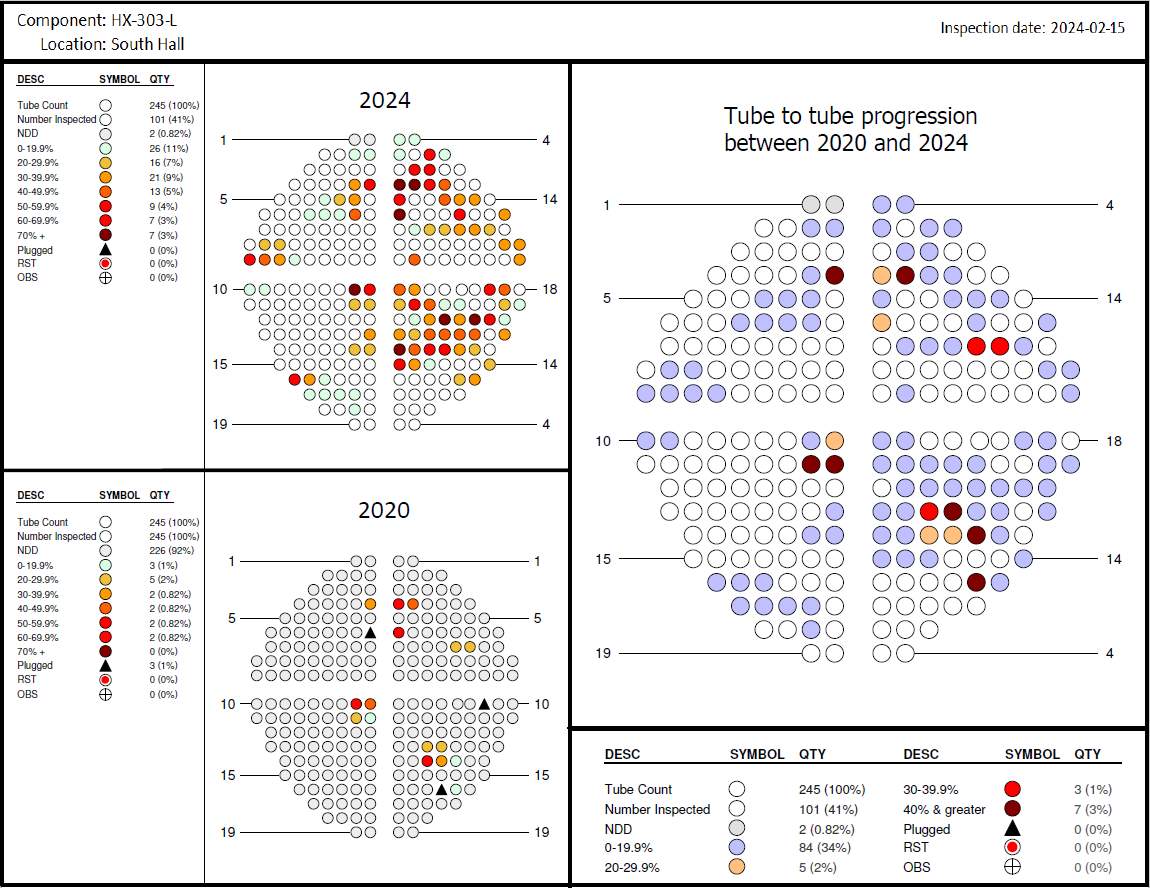
Two data sets can be added and analyzed in the same report, increasing the added value of your tubing inspection report. This feature enables the user to instantly visualize the current condition of the tube bundle and compare it to previously recorded data. Therefore, asset owners are best positioned to identify trends and take actions to protect their assets.
Moreover, this feature helps compare inspections performed using two different techniques on the same bundle. For example, if a bundle is tested with remote-field testing (RFT) and some tubes are rescanned with internal rotary inspection system (IRIS), both results can be displayed in a comparison view.
Learn more about project templates for fast and repeatable inspection reports here.
Active link with Magnifi software
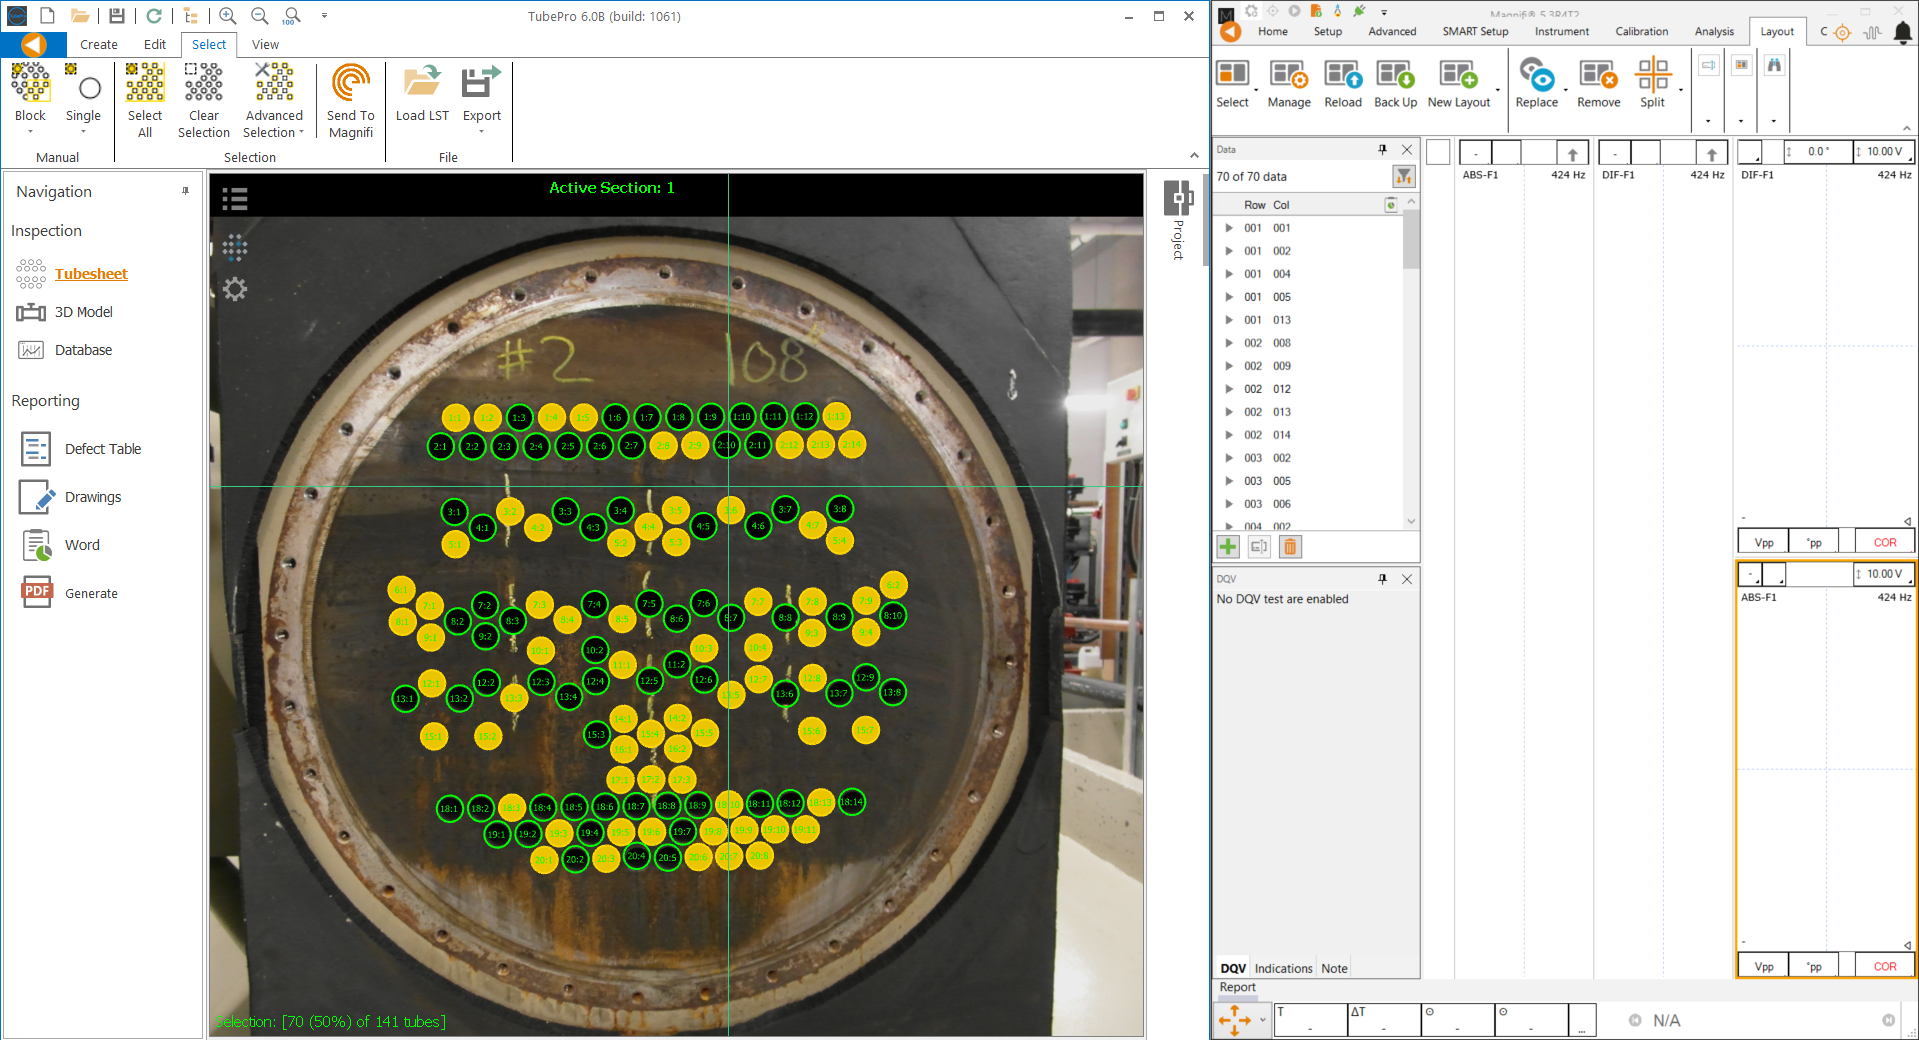
After creating the heat exchanger map, the tube list can effortlessly be transmitted to Magnifi, ensuring the operator is poised to proceed once the setup is finalized. While the option exists to send the entire tube list, users can also make partial selections based on patterns or free-form choices. Then, during analysis, indications entered by the analyst in Magnifi will be promptly displayed on the 2D view in TubePro.
Learn more about additional connectivity tools offered by Eddyfi Technologies here.
Training available for efficient onboarding
The interface of TubePro 6 is designed to help users move around the software seamlessly. Starting with a template, the user can go from creating and editing a tubesheet to building the 3D model and importing the defect inspection table, before finalizing the report in Word or Excel format.
To support users in harnessing the full potential of TubePro, a complete eLearning course for TubePro 6 is available at the Eddyfi Academy. This online course covers various workflows within the software, empowering users to leverage the software’s capabilities while ensuring continuous learning.