
With Codes and Standards now incorporating TFM as a recognized NDT technique, Total Focusing Method (TFM) is becoming the subject of discussions in the NDT community. One of the advantages of TFM is the possibility of detecting defects through a multiplicity of paths or modes. Using the specimen boundaries (mainly the backwall), it is possible to view indications from different directions taking into account mode conversion as well.
Today, we focus on the indirect mode called TT-TT. According to ASME V, TT-TT is defined as an indirect transmit and indirect receive mode as can be seen in the following animation.
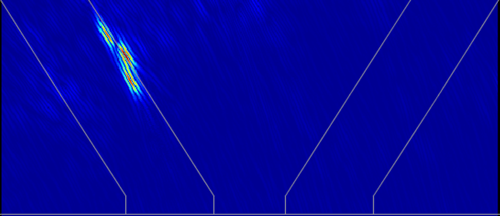
Essentially, the wave propagates from the emitters to the backwall, reflects off it to reach each pixel of the TFM image, back to the backwall, and back to all the receivers of the array probe. Like all the other indirect modes, the TT-TT mode is only calculated within the thickness of the test piece, i.e., no pixel can be calculated outside the component. The following image shows a TT-TT TFM illustration obtained with a 64L5-G3 probe and an SW55 wedge. The component is a 0.5” V weld. The image shows a side wall crack correctly positioned along the bevel of the weld.
For weld inspection, ASME V states that direct imaging paths (T-T for example) alone should not be considered for a full volume examination. Direct modes (L-L or T-T) are usually favored for the detection of indications close to the root, such as lack of penetration or root cracks, while full skip modes like TT-TT are used for weld bevel, weld cap and volume inspection. In a way, it is very similar to Phased Array Ultrasonic Testing (PAUT) inspections, for which high angle beams are used to inspect the bottom part of the weld and low angle beams inspect the rest on the second leg. PAUT inspectors have been trained on and are used to visualizing sectorial scans that show the first and second legs at the same time with a symmetric weld overlay.
While it is possible to calculate the modes and display them separately, there are advantages to displaying them on the same image. First, it gives an image similar to what PAUT operators are used to, indications close to the backwall (lack of penetration, root cracks, etc.) are not cut in half in the image and it allows for only one calibration.
To display both modes simultaneously, we calculate a T-T TFM image and extend the image to two times the component thickness. The mirror part of the TFM image is the TT-TT mode as explained in the following animation.
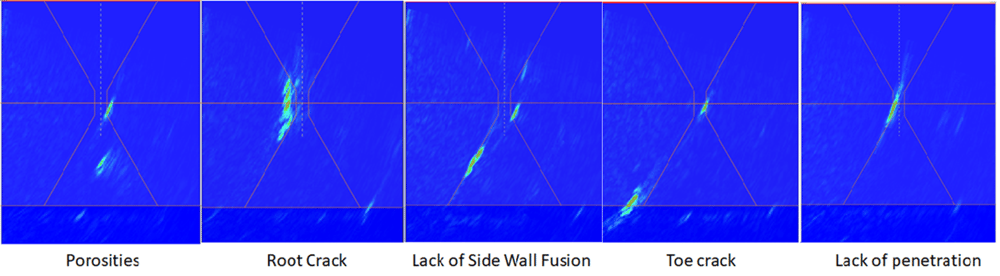
To illustrate this, we acquired FMC/TFM data on a 1” V-weld using a 64L5-G3 probe with an SW55 wedge. We chose a 45x55 mm TFM area, high enough to capture data on the first (T-T) and second (TT-TT) legs with a number of pixels (196 kpixels) calculated to pass the Amplitude Fidelity requirement.
We can see the various defects positioned either on the first leg (T-T mode) and/or second leg (TT-TT mode). The interpretation is as easy as PAUT, but with the high focusing provided by TFM, so there is no need to worry about where to focus the energy. Tip diffraction echoes are visible allowing for easy defect characterization. And, it is compatible with ASME as two modes (T-T and TT-TT) are used.
Download this guide on the seven questions you should ask when choosing your next phased array UT solution. Interested in learning more about the Total Focusing Method? Check out our webinar on how life is better with TFM. Finally, we’ve got a team of global experts that would love to answer your specific questions; contact us today!